Overwhelmed by guesswork around resourcing? Eliminate daily lost productivity and make confident decisions powered by robust time data analytics.
Key Takeaways
- Timesheets.com brings critical visibility into team productivity
- Custom tagging adds contextual labels to time data for flexible analysis of critical time tracking statistics.
- Interactive data visualizations transform complex time inputs into digestible graphs.
- Analytics expose inflated or deficient utilization patterns needing rebalancing to optimize resource allocation.
- Model future plans through data predictions instead of assumptions for confident capacity forecasting.
Index:
- Supercharge Decisions with Timesheets.com Analytics
- Automated Time Tracking
- Advanced Tagging for Context
- Interactive Data Visualizations
- Spot Bottlenecks
- Confidently Project Resourcing Needs
- Optimize Resource Allocation
- Continually Refine Plans
- Share Actionable Intelligence Across Teams
- Conclusion
- Frequently Asked Questions
Outdated assumptions around resourcing capacity often shackle workforce agility.
As organizations grow increasingly dynamic, the cost of misaligned roles and overextended departments multiplies over time. Last minute crunches spread teams thin quarter after quarter.
Step into the light with workforce analytics, exposing precise effort patterns across your teams.
Supercharge Decisions with Timesheets.com Analytics
Timesheets.com transforms scattered guesswork around capacity planning into confident and nimble role structuring. Our time science achieves accuracy at scale, finally reaching what clunky spreadsheets never could.
Timesheets’ automated time tracking system logs how work flows across every worker and initiative without any manual reporting.
Operating by intuition gets increasingly risky as every CEO knows, and basing decisions on assumptions is not an exact science.
But why not make it one if it helps your business?
Power up confident staff planning with time precision data exposing the reality of how you spend your time. Right size your organization’s roles and capacity through Timesheets’ modern workforce analytics.
Powerful reporting converts these insights into data-backed models for right-sizing roles, catching capacity gaps or bottlenecks early.
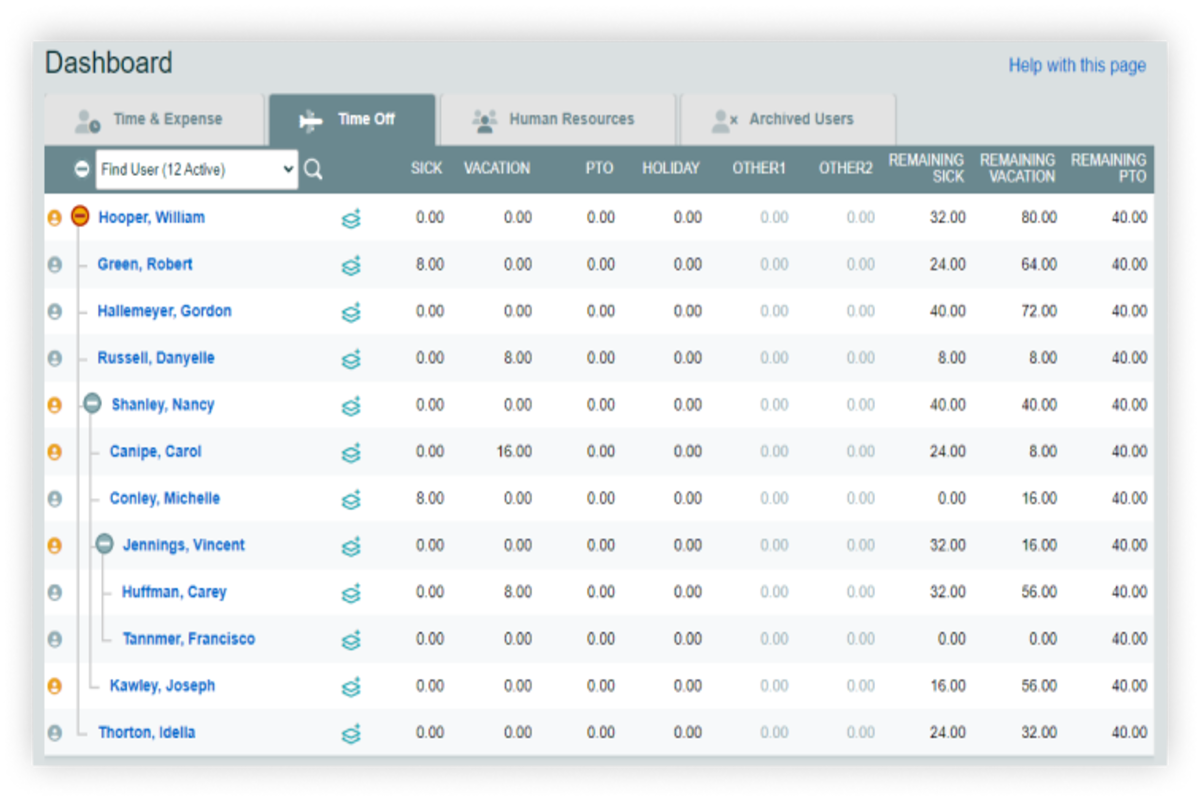
- Seamless Time Capture - Silently logs all activity across tools and browsers without any manual reporting. Provides pure behavioral data from the source.
- Interactive Visualizations - Dashboards transform time insights into digestible trends, summaries, and projections. Filter by worker, program, or activity.
- Bottleneck Identification - Pinpoint over and underworked teams by effort allocation patterns. Spot capacity drains or gaps by initiative. Right size roles.
- Confident Scenario Planning- Accurately model the workforce impact of adding staff or new projects based on historical time allocation data. Optimize planning through data predictions.
Now armed with the ground truth of where efforts go currently, Timesheets engineers a more productive workforce that’s right in your wheelhouse.
Unlock Productivity
Start Your Free Trial Now!


Automated Time Tracking
Still piecing together disjointed activity reports? Achieve effortless total visibility through automated capture by Timesheets.com.
Don’t depend on inconsistent manual timesheets and clunky spreadsheets compiled through bias-prone self-reporting. Timesheets silently tracks all real activity across work devices without any extra effort from employees.
Our intelligent desktop and web tracker runs behind-the-scenes logging every app and website users access.
By automatically capturing where efforts truly go minute-by-minute, you gain total visibility into your team’s workflows.
Team members remain focused on core contributions during working hours. No added administrative hassle skewing data.

Rich Filters Reveal Dimensions
Comprehensive filters allow honing in on particular projects, departments, clients, or other dimensions as needed for custom analysis.
See the range of sites software developers use daily versus social media efforts from marketing. Breakdowns by operating grant or funding sources expose allocation across mission areas.
Track time investment across programs and specific campaigns simultaneously. Compare output from contractors versus full-time staff on the same projects.
Evolve beyond fragmented manual timesheets that produce incomplete pictures tied up in reporting bias.
Timesheets upgrades leaders to effortless, companywide visibility. Make informed workforce decisions that are grounded in reality, not estimates.
Advanced Tagging for Context
Tired of squinting at spreadsheets full of numbers? Timesheets’ configurable tagging adds custom intelligence to raw data.
While a seamless automated time tracking tool provides an invaluable foundation, the story remains incomplete without insightful context.
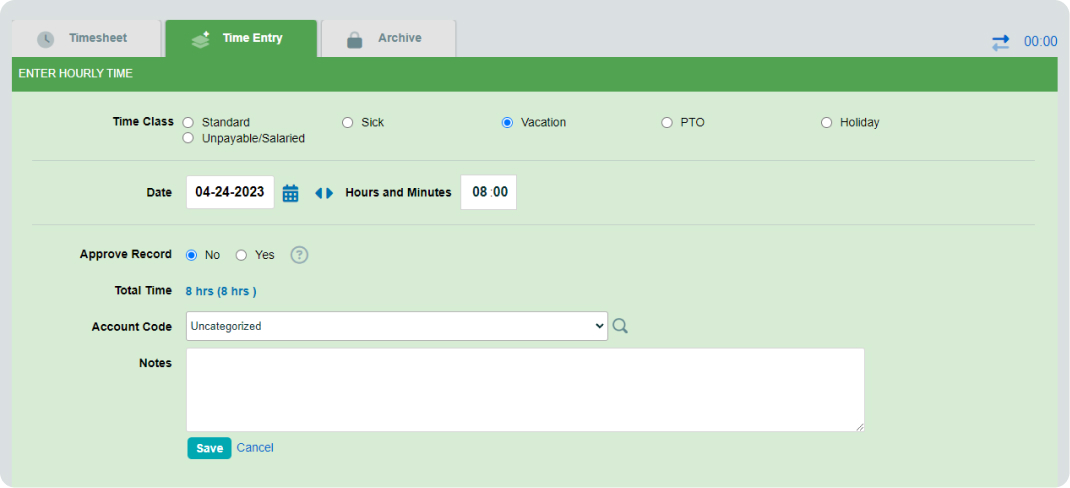
Timesheets allows adding unlimited customizable tags to classify efforts, spotlight priorities, and tailor analysis. No additional data science resources are required.
Tag Programs, Projects, Funders
Comprehensive filters allow honing in on particular projects, departments, clients, or other dimensions as needed for custom analysis.
See the range of sites software developers use daily versus social media efforts from marketing. Breakdowns by operating grant or funding sources expose allocation across mission areas.
Classify Roles and Departments
Break down time utilization patterns by departments, individual roles, or employment status whether full-time, contract, or outsourced. Right-size growing areas require more internal specialization.

Configure Work Taxonomies
Establish conventions classifying Core Hours supporting general operations, Internal Projects improving systems, and Client Billable hours and activities integrating payroll with timesheets systems for accurate financial planning.
Sophisticated tagging empowers by framing the data to focus on strategic areas and confidently plan resourcing responses. This keeps productivity and purpose aligned across the organization.
Interactive Data Visualizations
There’s untapped potential in spreadsheet reports overflowing with figures. But they often fail to convey actionable intelligence at a quick glance.
Timesheets’ meticulously designed dashboards transform exhaustive time data into dynamic visualizations. It does this by distilling key patterns, trends, and projections focused on optimizing team productivity.

Activity Summaries
Summary charts showcase macro-level splits like time allocation across all programs or weekly efforts broken down by department.
Quickly see total productive versus non-productive time, organization wide
Initiative Deep Dives
Filter into particular initiatives like Client X website overhaul or State Y services outreach to view multi-week efforts by specific personnel at a granular level.
Spot workload imbalances early.
Pinpoint overburdened roles compared to output by focusing on comparisons like sales leads generated per hour logged daily, monthly, or per campaign.
Right-size teams according to productivity metrics you define rather than hunches.
Custom Modeling
Leverage dashboards to accurately model adjustments in roles, staff levels, or support resources needed if adding another major initiative next quarter.
Confidently predict and adjust resourcing via data.
With versatile visuals condensing complex workforce variables into easily digested views, Timesheets dashboards promote leading smarter through data every step.
Spot Bottlenecks
It’s flat out impossible to manually detect resource-draining bottlenecks. But Timesheets’ analytics pinpoint roadblocks in real time.
Like warning lights on a car dashboard, Timesheets alerts leaders to emerging workload imbalances, drops in productivity metrics, or cross-team dependencies stalling output.

Proactively uncover obstacles before they throttle results.
- 1. Effort Imbalances Automated tracking quickly exposes teams burning late nights while others coast under capacity.
- 2. Output Gaps Custom dashboard views compare projects' time investments next to key results produced, like number of proposals generated weekly.
- 3. Role Misalignments Cross filter data by role and specific initiatives to uncover mismatches between expectations and actual skills applied.
- 4. Cross-Team Dependencies Time data combined with milestones reached illuminates hand-offs stalling between departments.
- 6. Activity Changes Are there suddenly more hours going towards maintenance over innovation this quarter? Dashboard trends catch strategy drifts quickly for decisive course corrections restoring priorities.
- 7. Individual Anomalies Analytics spotlight particular workers with sudden changes in productivity metrics or time allocation, warranting coaching assessments to correct.
- 8. Capacity Forecasts As pipelines and new initiatives scale, review dashboards to accurately forecast additional roles and resources required.
Don’t left neglected bottlenecks silently throttle productivity and strategic progress. Timesheets’ analytics spotlight emerging issues for you to eliminate.
Confidently Project Resourcing Needs
End guessing games around capacity forecasts. Timesheets offers precision workforce analytics guiding responsible scaling.
Rather than relying on assumptions and guesses, Timesheets’ accuracy is grounded in historical behavioral data.
No more hastily throwing headcount at urgent needs risking overcorrection or burnout.

Part 1: Current Utilization Baselines
Establish an honest look at existing time investments across the organization. Pay attention to activity tags and dashboards tracking detailed efforts on granular initiatives and specialized roles.
Get clarity on who shoulders lower-priority work that could shift as a buffer. See how close resources hover to burnout benchmarks already. These truthful baselines anchor expansion plans to reality.
Part 2: Pending Expansion Plans
Catalog new ambitions over the horizon that necessitate workforce growth whether developing products, entering additional markets, or launching major programs.
Estimate preliminary capacity and skill demands that each incremental milestone demands from different departments by quarter.
Model aggressive plans still requiring nights/weekends versus sustainably-paced progress during work hours.
Part 3: Data-Backed Gap Analysis
Overlay pending expansion and milestone plans onto current utilization baselines visualized in Timesheets. From this, quantify exactly where resource gaps emerge by workload type and specialization.
Account for vacations and likely attrition in planning additional hiring goals well ahead of crisis points. Iterate modelling different role team sizes at each growth phase.
Part 4: Confident Capacity Planning
Establish an honest look at existing time investments across the organization. Pay attention to activity tags and dashboards tracking detailed efforts on granular initiatives and specialized roles.
Get clarity on who shoulders lower-priority work that could shift as a buffer. See how close resources hover to burnout benchmarks already. These truthful baselines anchor expansion plans to reality.

Effortless Time Management
Get Started with a Free Trial!
Optimize Resource Allocation
Scattershot hiring drains budgets, yet overburdens teams. Timesheets’ allocation intelligence funds growth sustainably.
Budget overruns from overhiring lag behind realizing untenable workloads, requiring further emergency support.
Yet ragged teams struggle meeting demands that could flow efficiently from structured cross-training and coordination.

Timesheets’ workflow analytics guide decisions optimizing existing team capacity while mapping precise gaps needing managed increase.
Custom allocation upgrades counter slow-to-adapt tribal knowledge around assignments unable to keep pace with growth.
With clarity on existing utilization patterns in place, Timesheets empowers optimized distribution of talent according to capabilities and latest strategic targets.
- 1. Cross-train emerging leaders handling lower-priority responsibilities into higher impact areas as your team models right-size departments needing deeper specialization there.
- 2. Adjust contractor roles to expand dynamically where pending initiatives require fast ramp up past current headcount budget.
- 3. Converge project contributors for tighter feedback loops, accelerating workflows rather than siloed hand-offs.
- 4. Narrow focus highest performers on exclusive making-or-breaking priorities to achieve relentless push towards critical goals.
- 6. Automate alerts flagging redundancies such as suddenly non-specialized personnel logging time in high expertise domains, warranting workload rebalancing.
Scattershot hiring fails to recognize that interconnected productivity flows depend on coordinated specialty training, aligned incentives, and streamlined interoperations – all evolving quicker than rigid budgets can fund responsively.
Timesheets’ allocation intelligence sustains growth through optimizing existing capacity first. Then data-backed gap analysis guides strategic increases, keeping budgets focused on value-driving talent.
Continually Refine Plans
Success demands rigid strategic plans, but fluid adaptive execution. Timesheets equips leaders to respond decisively.
The most brilliant top-down goals mean little if stale strategies waste resources marching the wrong directions.
Sudden market shifts and emerging data warrant course corrections to reoptimize effect.
Timesheets fuels decisiveness through continual workflow insights, monitoring indicators towards key results.

Monthly Reviews
Establish 30 to 60-day recurring touchpoints reviewing latest dashboards on milestone progress, team allocation adjustments, and capacity utilization red flags that need rightsizing.
Validate priorities, still tying lower-level activity back to top objectives amidst distractions.
Quarterly Replanning
Major initiatives require more responsive planning cycles as project management demands solidify through initial implementation.
Adjust Timesheets custom tags, clarifying new review needs and success metrics. Add fresh views combining indicators for holistic assessment. Update budgets forecasting true costs ahead through data accuracy.
Annual Vision Valuation
Beside quarterly realignments, annually revalidate the vision and integrity driving organizations forward. Do projected growth models still compute given latest capacity utilization patterns?
Are inflation adjustments inflating certain functions disproportionately to value, signaling need for incentives rebalancing or even outsourcing? Total strategy resets prevent irrecoverable inertia.
Equip executives and managers regularly, recalibrating execution tied to outcomes for optimal impact.
Timesheets supplies speed, accuracy, and perspective, enabling responsive leadership.
Share Actionable Intelligence Across Teams
Decisions made in darkness perpetuate silos. Timesheets illuminates workflows enterprise-wide.

End Data Secrecy
When productivity data and planning insights stay isolated within management, operations remain chained to status quos, failing bottom-up innovations.
Middle managers seem arbitrary instead of visionary leaders, without insights informing their priorities.
But dismantling data secrecy ushers in a new era of perspective, ownership, and possibility.
Broaden Visibility, Expanding Possibilities
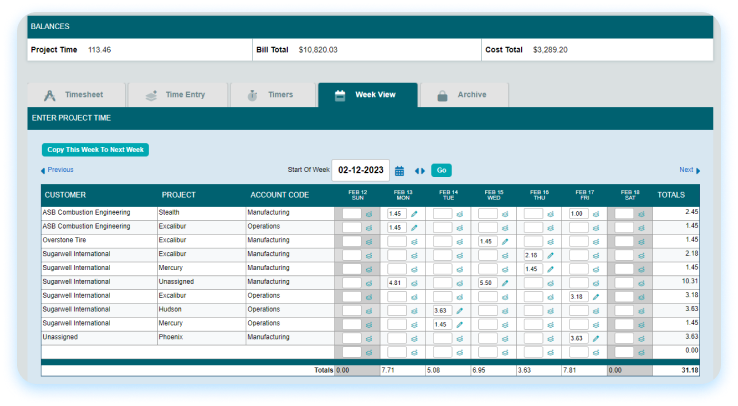
Now anyone can visualize end-to-end business processes cutting across their work rather than just isolated micro views.
Customer support grasps how backlogged engineering queues throttle their response times. Product developers see downstream usage trends shaping more intuitive features.
Frontline staff no longer stay stuck in obscure micro efforts, instead rallying collaborators to fix shared bottlenecks that frustrate all.
Empower Improvements Percolating Up
Leadership retains focus on broader strategy, empowering improvement initiatives that are percolating up based on open data accountability.
Every employee brings specialized-effort data to light, matching their ground truth vantage point while maintaining equal view into the full vision keeping all strides aligned.
Outdated shadow hierarchies fade as equal education fuels innovation from every seat. Workforce ingenuity ignites everyone.
The broad data literacy breaking walls for full visibility allows your purpose and progress to permeate every cubicle, monitor, and mind through shared truth.
Imagine the speed of transformations when matching strengths to critical needs seamlessly at enterprise scale. That future unlocks when Timesheets sheds light out of darkness.

Conclusion
Those overwhelmed by outdated guesswork around resourcing can initiate a new era boosting output through data-driven clarity.
By automating time tracking for small businesses of real staff efforts, then adding context via custom tags, raw time inputs convert into sophisticated intelligence optimizing how teams drive strategic results.
Interactive dashboards condense exhaustive activity volumes into digestible visualizations. These spotlight workflow patterns, productivity metrics, and capacity utilization trends.
Model the precise impact of any initiatives or team structure changes ahead of disruptive investment using proven data.
Know where hidden capacity already exists within current workloads needing rebalancing.
The future belongs to organizations that unlock workforce ingenuity rooted in accountability.
Timesheets’ digital tools supply the accurate automation, configurable classification, and actionable visibility needed to convert tribal knowledge around resourcing into smarter decisions benefiting all tiers.
Start engineering precision productivity powered by time insights today.
Frequently Asked Questions

What is the concept of time tracking?

Time tracking software involves recording the time spent on various tasks and projects by employees, often accomplished through timekeeping tools that automatically log work on different systems.

What is the objective of time tracking?

The main objectives of time tracking systems are to understand how effort gets allocated currently, identify areas for improved efficiency, ensure projects stay within budget, and enhance data-driven decision-making around resourcing and planning.

What is the value of time tracking?

Effective time tracking provides visibility into productivity patterns, bottlenecks, and capacity utilization that optimize team productivity tools and management and shape smarter organizational changes.

How do you implement time tracking?

Time tracking is commonly implemented using dedicated software that automatically records tasks across tools and allows manual categorization of efforts. Smooth adoption of time tracking tools requires executive buy-in, employee communication, and tying insights back into operations optimizations.

Does time tracking improve productivity?

Yes, leveraging time insights to streamline workflows, plan resourcing responsively, and reinforce focus on high-impact activities consistently demonstrates productivity gains, plus continuous incremental improvements.


